Create Free Data Charts
Unlock powerful data visualization with a free Data Chart Maker from Jotform. Create professional data charts to present your data seamlessly and efficiently. Customize and tailor your charts to simplify complex information so your audience can uncover new insights and make smarter business decisions. Start transforming your data into impactful charts today!
القوالب
استكشاف قوالب الاستطلاعات
استطلاع وسائل التواصل الاجتماعي

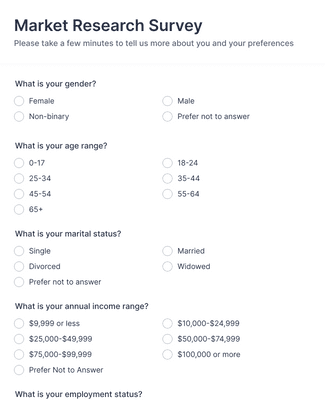
استطلاعات أبحاث السوق
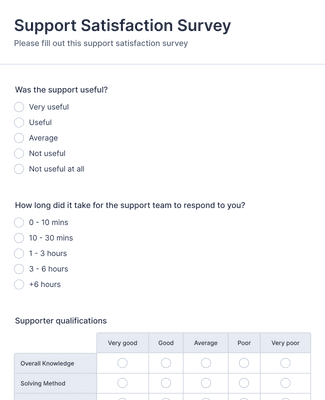
استطلاع رضا العملاء عن الدعم
المزايا
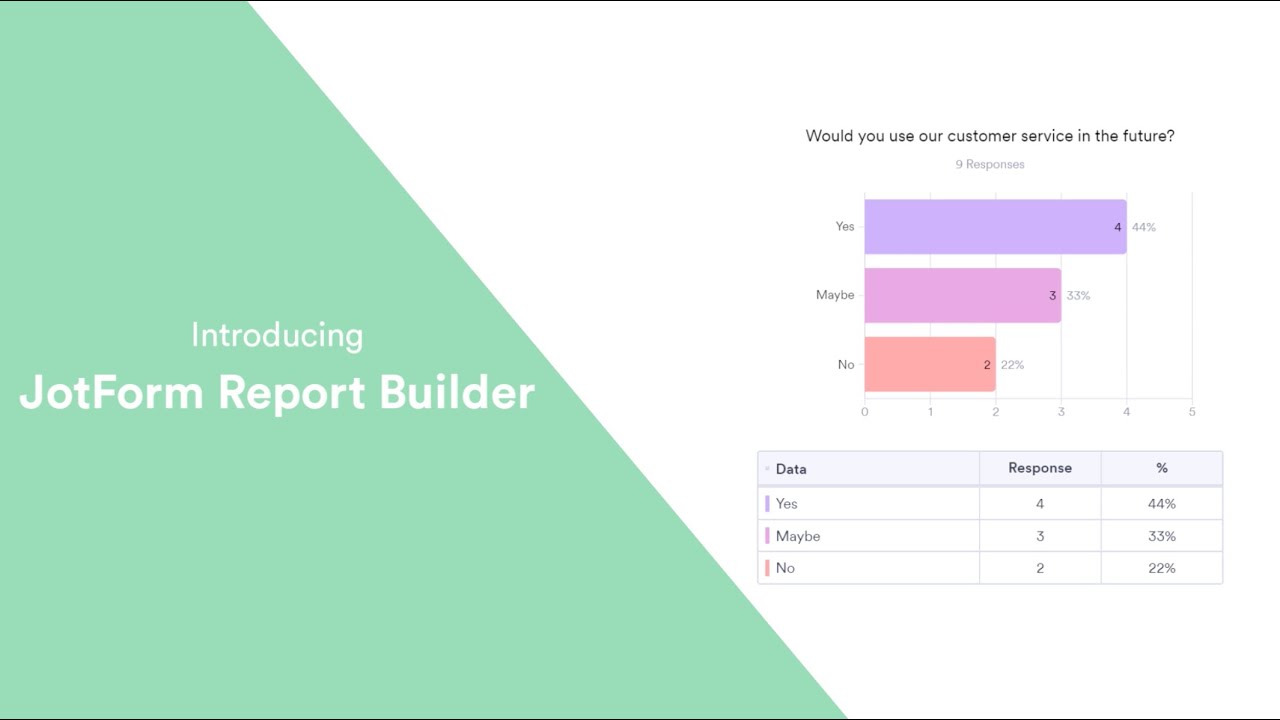
إنشاء مخططات بيانات فورًا
Seamless data conversion
Jotform’s Data Chart Maker lets you visualize your data effortlessly, turning raw numbers into clear, professional-looking charts. Plus, you can generate custom reports to share with your colleagues or stakeholders using Report Builder.
مخططات قابلة للتخصيص
Tailor your charts to fit your specific needs and preferences with Jotform’s drag-and-drop Report Builder. You can customize colors, labels, and other design elements to build charts that align perfectly with your company branding or presentation style.
Embed your data anywhere
Embed reports on your website or social media platforms without any coding so your audience can access your data charts instantly. The best part? Embedded reports will update automatically with each new submission, so you won’t need to constantly update them!
Share your reports in seconds
لتسريع سير عملك، شارك مخططات البيانات الخاصة بك مع زملائك، عملائك، وأصحاب المصلحة بنقرات قليلة. يمكنك إرسال التقارير كملف PDF، عبر البريد الإلكتروني أو الرابط، أو في رمز QR لراحتك.
توصيات
ماذا يقول مستخدمونا عن Jotform؟
How to use Jotform Report Builder
الأسئلة الشائعة
جميع أسئلتك عن Jotform - تمت الإجابة عنها. تحقق من الأسئلة الشائعة للحصول على إجابات للأسئلة الشائعة، أو اتصل بفريق الدعم للحصول على مزيد من المعلومات.
هل صانع المخططات البيانية مجاني حقًا للاستخدام؟
Yes — the Data Chart Maker is free to use and always will be. It’s available on every plan, and there are no limits on the number of reports you can create. Whether you’re on our full-featured free plan, or you’ve upgraded for additional storage or HIPAA features, you can always create professional data charts to showcase your form responses and business status.
كيف يمكنني إنشاء مخطط بيانات باستخدام أداة صانع المخططات البيانية؟
Creating a data chart with the Data Chart Maker is simple. Go to Jotform’s Report Builder to get started, or select a form that you want to create a chart for in the form builder. Once you’ve clicked Create New Report, you can select a form, import data, or use a sample report. From there, you can customize the chart to your needs.
هل يمكنني تخصيص مظهر مخططات البيانات الخاصة بي؟
بالتأكيد يمكنك! باستخدام ميزات التخصيص بالسحب والإفلات من Jotform، يمكنك تخصيص مخططات البيانات حسب رغبتك عن طريق تغيير الخطوط والألوان، تحديث التسميات، إضافة عناصر العلامة التجارية، تبديل الصفوف والأعمدة، وأكثر من ذلك. يمنحك منشئ التقارير المرونة لبناء نماذج ومسوح المخططات من الصفر، أو الاستلهام من أحد القوالب الجاهزة لدينا. هل تحتاج لاستيراد بيانات من خارج Jotform إلى مخططاتك؟ يمكنك فعل ذلك أيضًا!
ما أنواع مخططات البيانات التي يمكنني إنشاؤها باستخدام الأداة؟
مع Jotform، يمكنك إنشاء عدة مخططات بيانات مختلفة حسب احتياجاتك. تشمل هذه المخططات الأساسية، الدونات، الفطيرة، الأعمدة، والأعمدة البيانية، وجميعها تأتي مع أساطير وجداول اختيارية. يمكنك تعديل البيانات وأسلوب المخطط في أي وقت، بحيث لا تضطر للبدء من جديد إذا احتاج المخطط إلى تحديثات أو تعديلات.
كيف يمكنني مشاركة مخططات البيانات الخاصة بي مع الآخرين؟
يمكنك مشاركة مخططات البيانات مع الآخرين عبر البريد الإلكتروني أو الرابط، كملف PDF، في رمز QR، أو عن طريق تضمينها في حسابات وسائل التواصل الاجتماعي أو الموقع الإلكتروني الخاص بك. هدفنا هو جعل مشاركة بياناتك سهلة قدر الإمكان، بحيث يمكنك إحداث تأثير على جمهورك واتخاذ قرارات أعمال أفضل.