Jotform offers a straightforward way to transform your Excel or CSV data into a fully customizable visual report. You can bring your data to life with charts, tables, slides, and other visual elements that make your information easier to understand and share. This process supports a smooth transition from raw data to insightful visuals, helping you analyze and present your information effectively—without the need for a complex setup or coding.
You can easily import data from your Excel or CSV file and turn it into visual reports. Here’s how to do it:
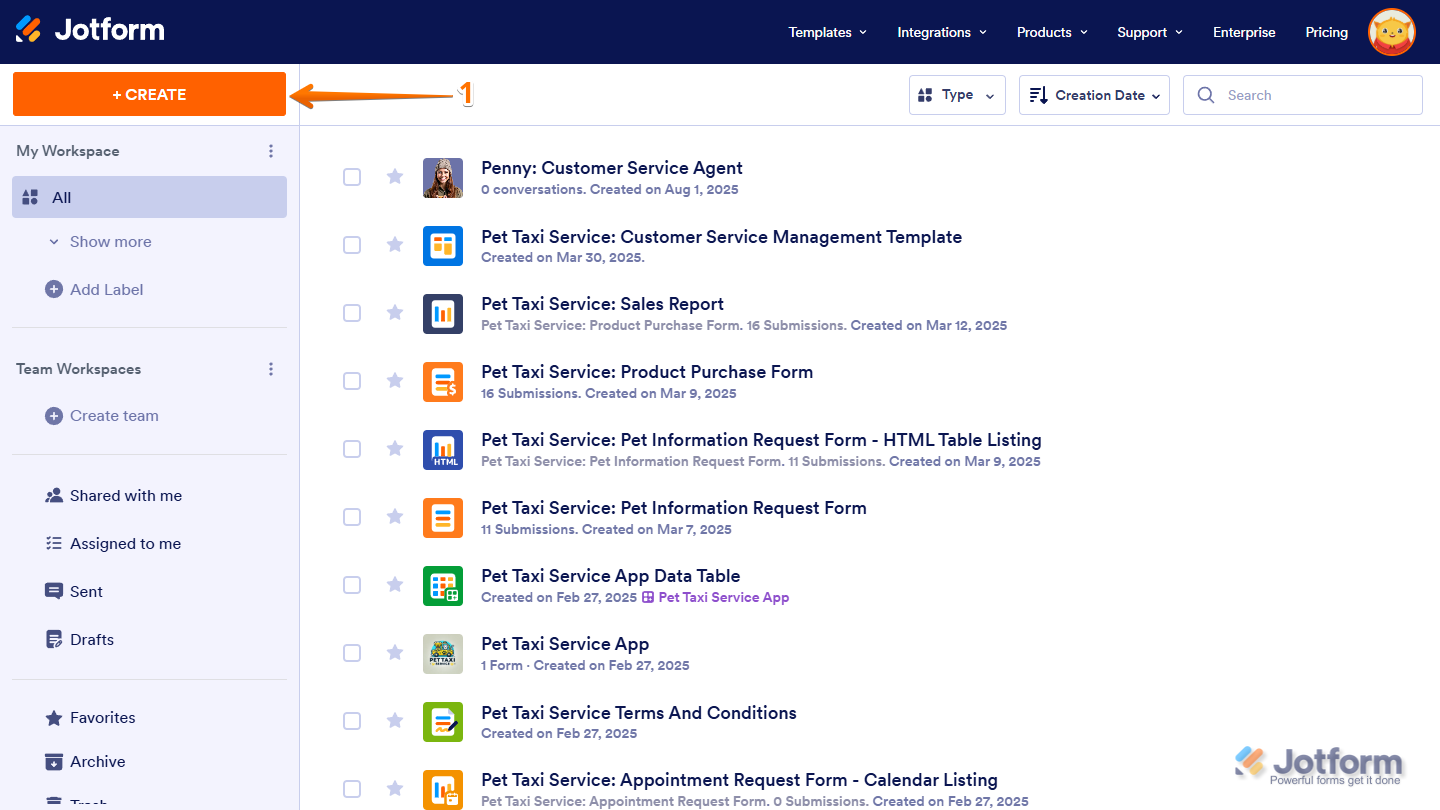
- On your Workspace page, click on Create on the top-left side of the screen.
- In the window that opens up, click on Report.
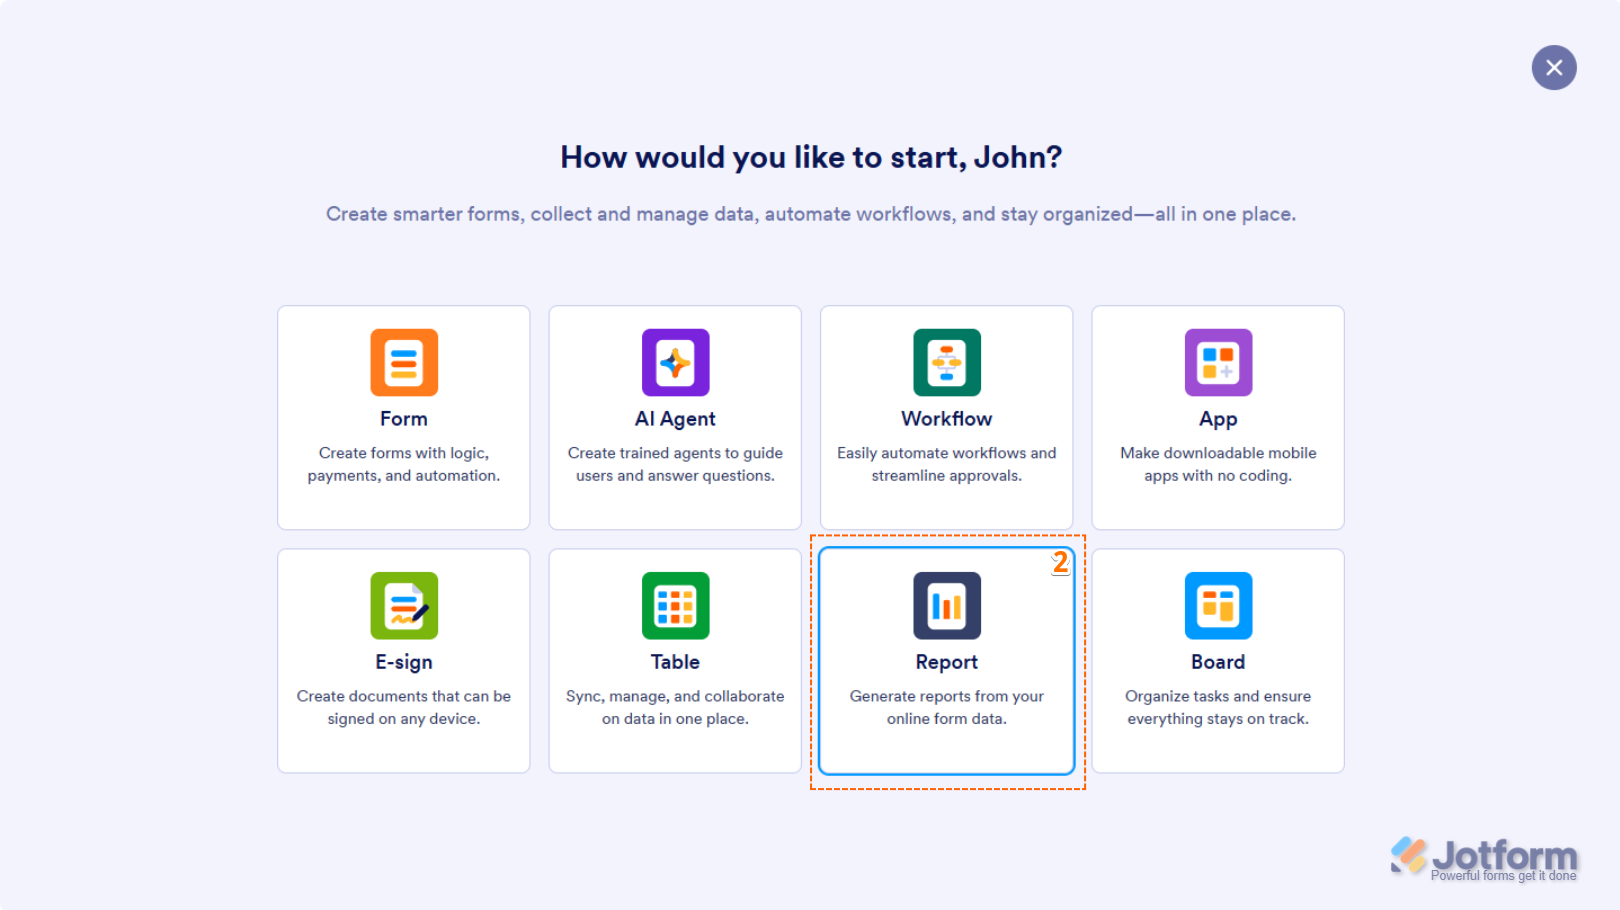
- Now, click on Visual Report.

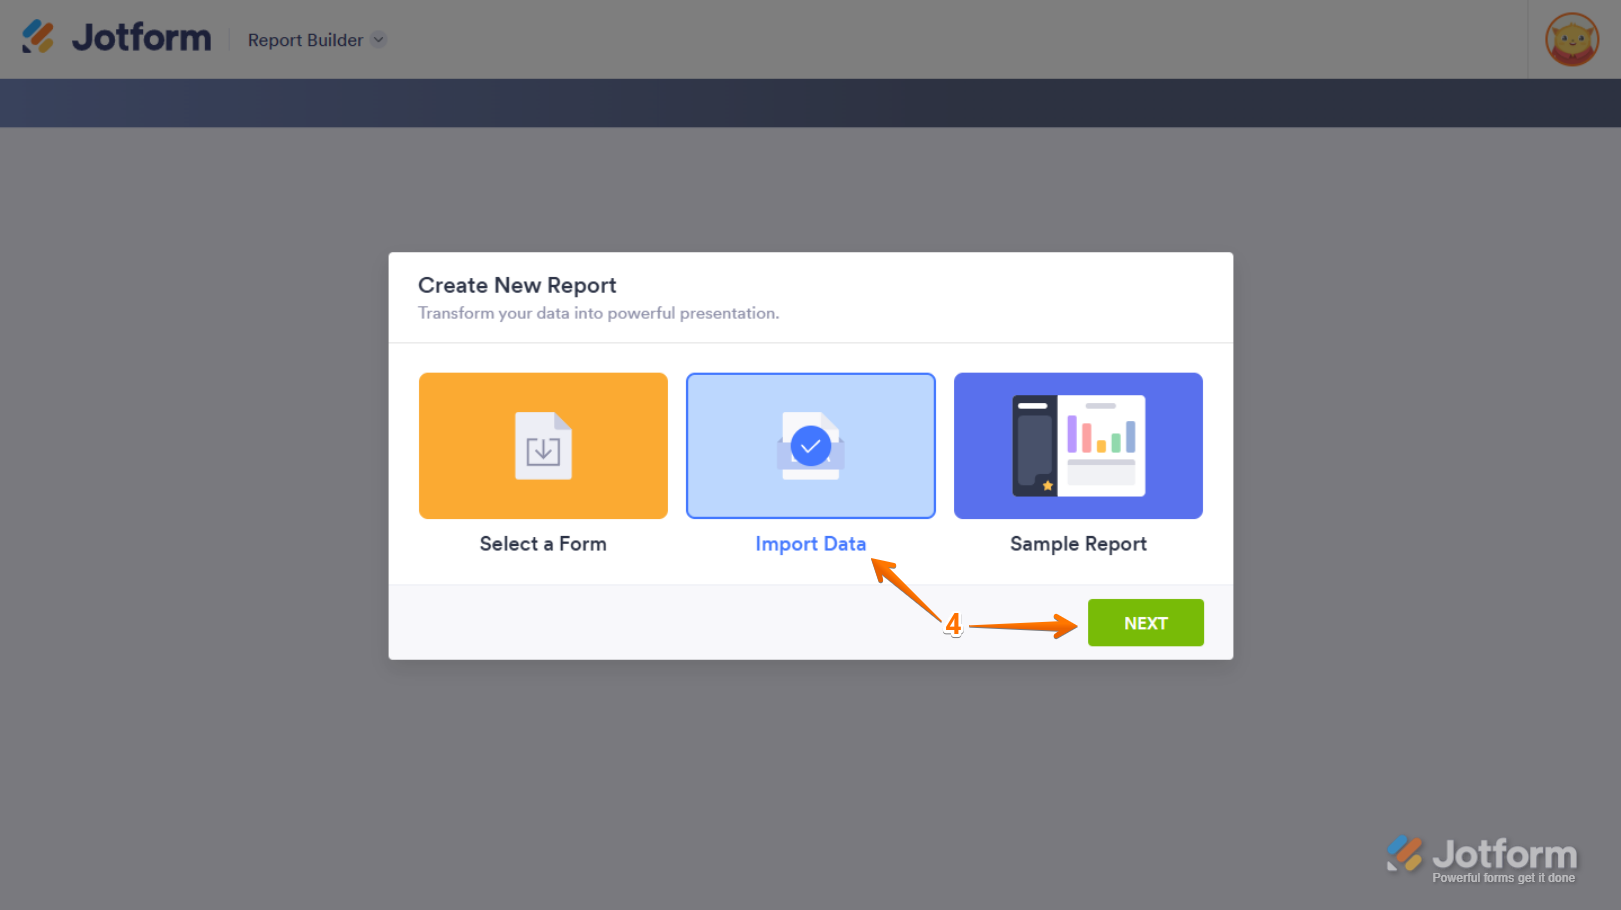
- Then, in Report Builder, click on Import Data in the Create New Report window and click on Next.
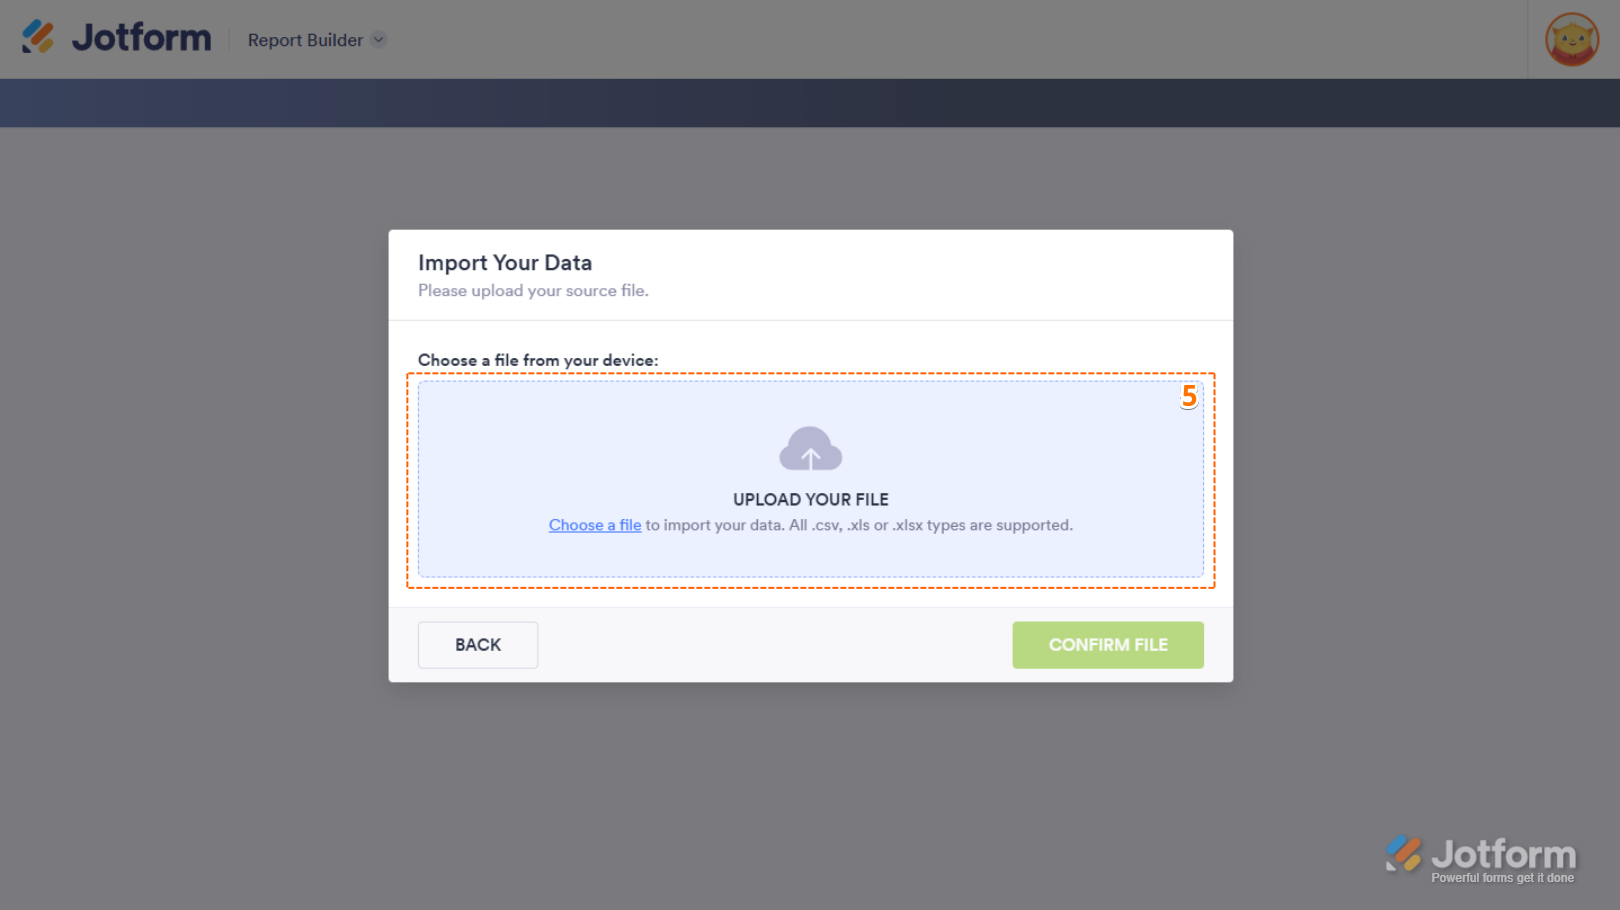
- In the middle of the Import Your Data window, click on Upload Your File to upload your Excel or CSV file from your device.
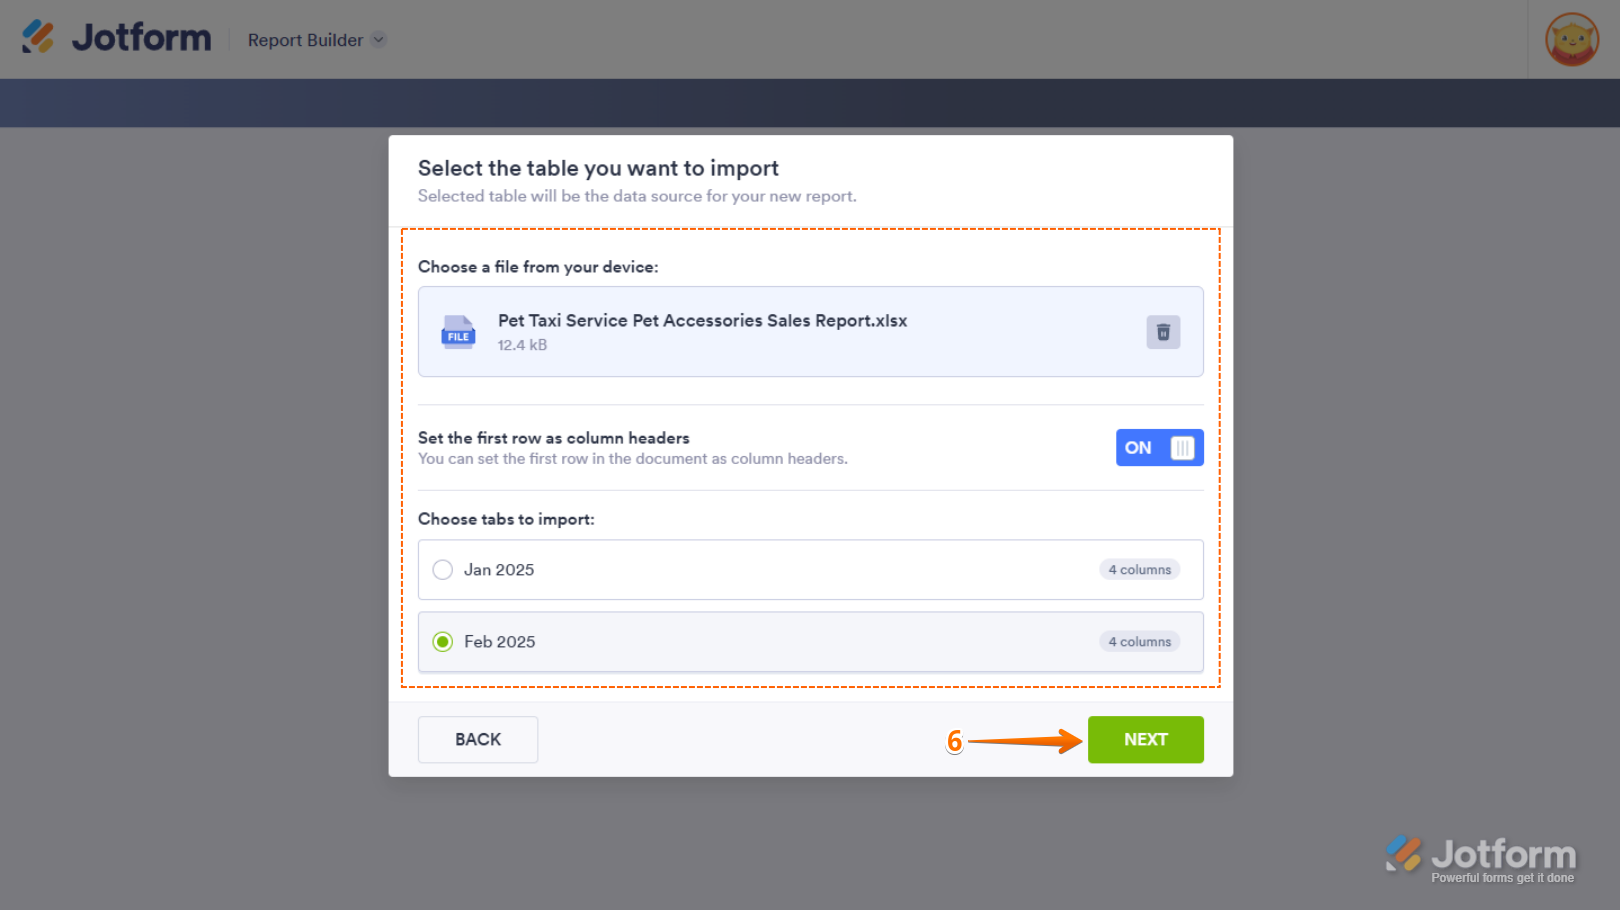
- Now, in the Select the Table You Want to Import window, use the following options to further configure your setup, and then click on Next:
- Choose a File from Your Device — Click on the Trash Can icon on the right of the file if you want to change it.
- Set the First Row as Column Headers — Toggle this setting to the On position if the data in your Excel or CSV file have column headers.
- Choose Tabs to Import — If your Excel or CSV file has more than one (1) worksheet, you can select the one you want to import.
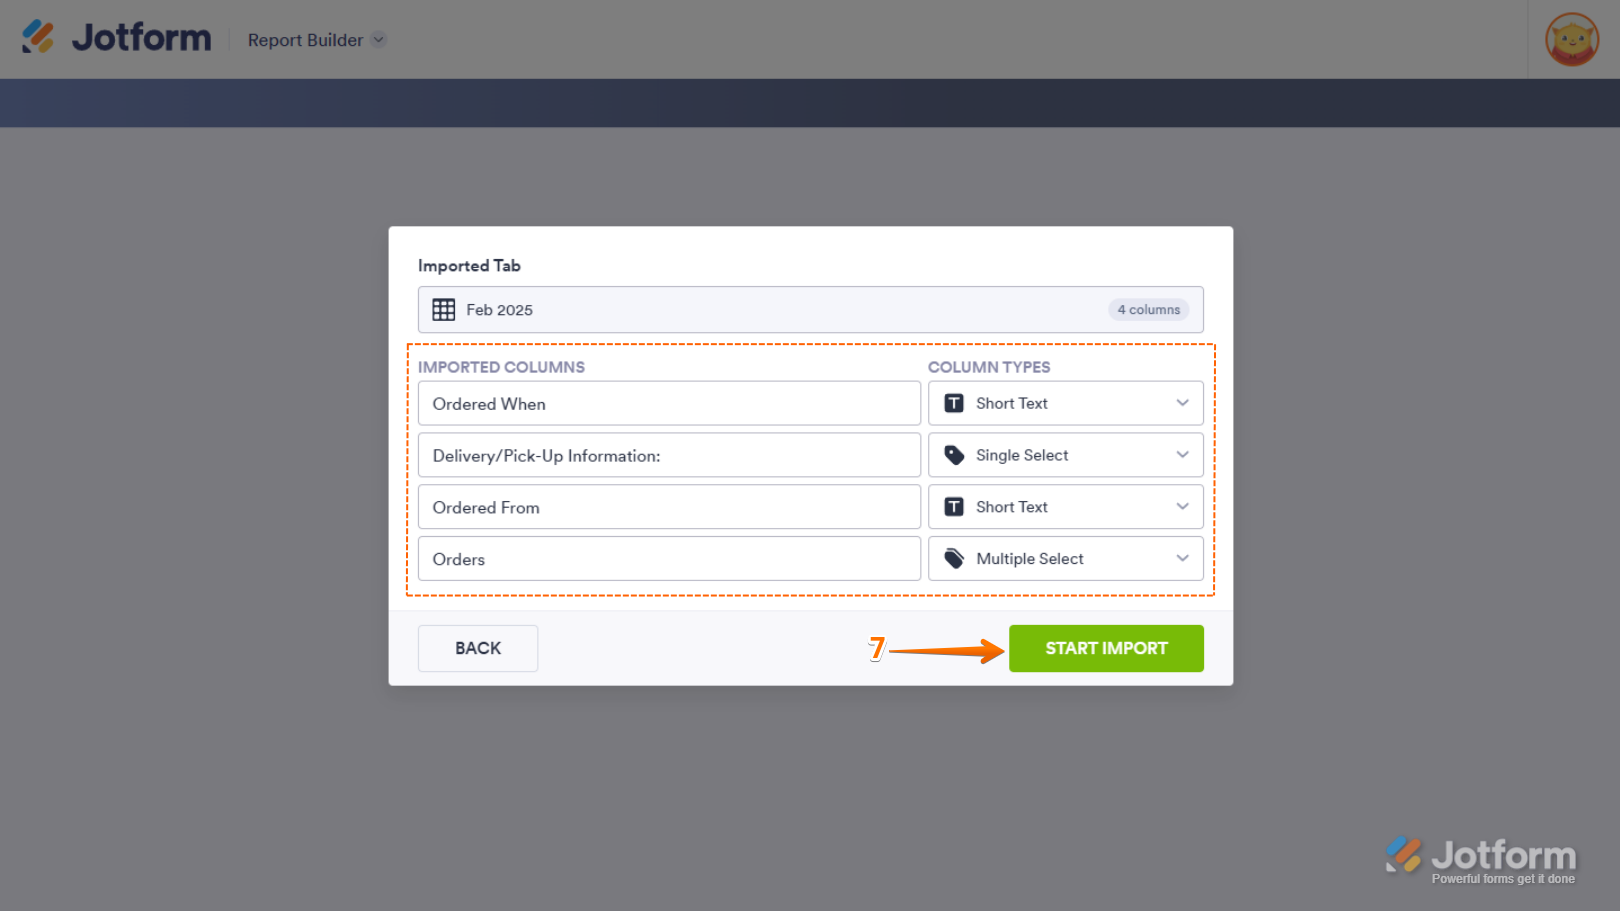
- Then, in the Imported Tab window, click on the Dropdown menu next to an imported column from your file to match it to a field type, and then click on Start Import to begin importing the data. This also creates a Table asset in your account automatically.
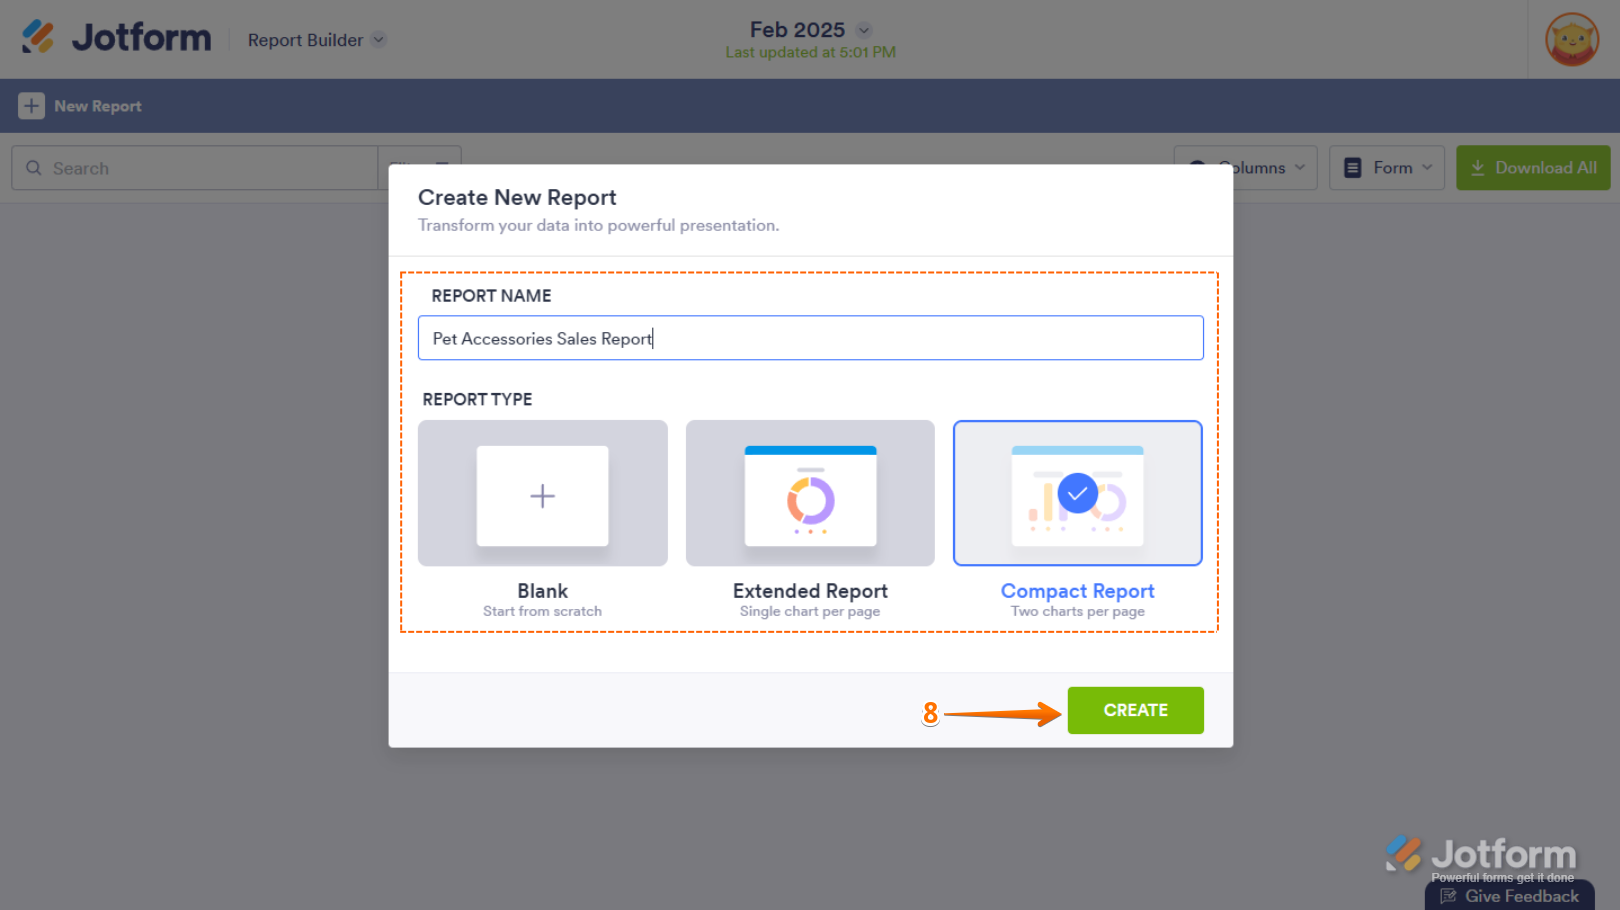
- Next, in the Create New Report window, enter a Report Name and select a Report Type, and then click on Create.
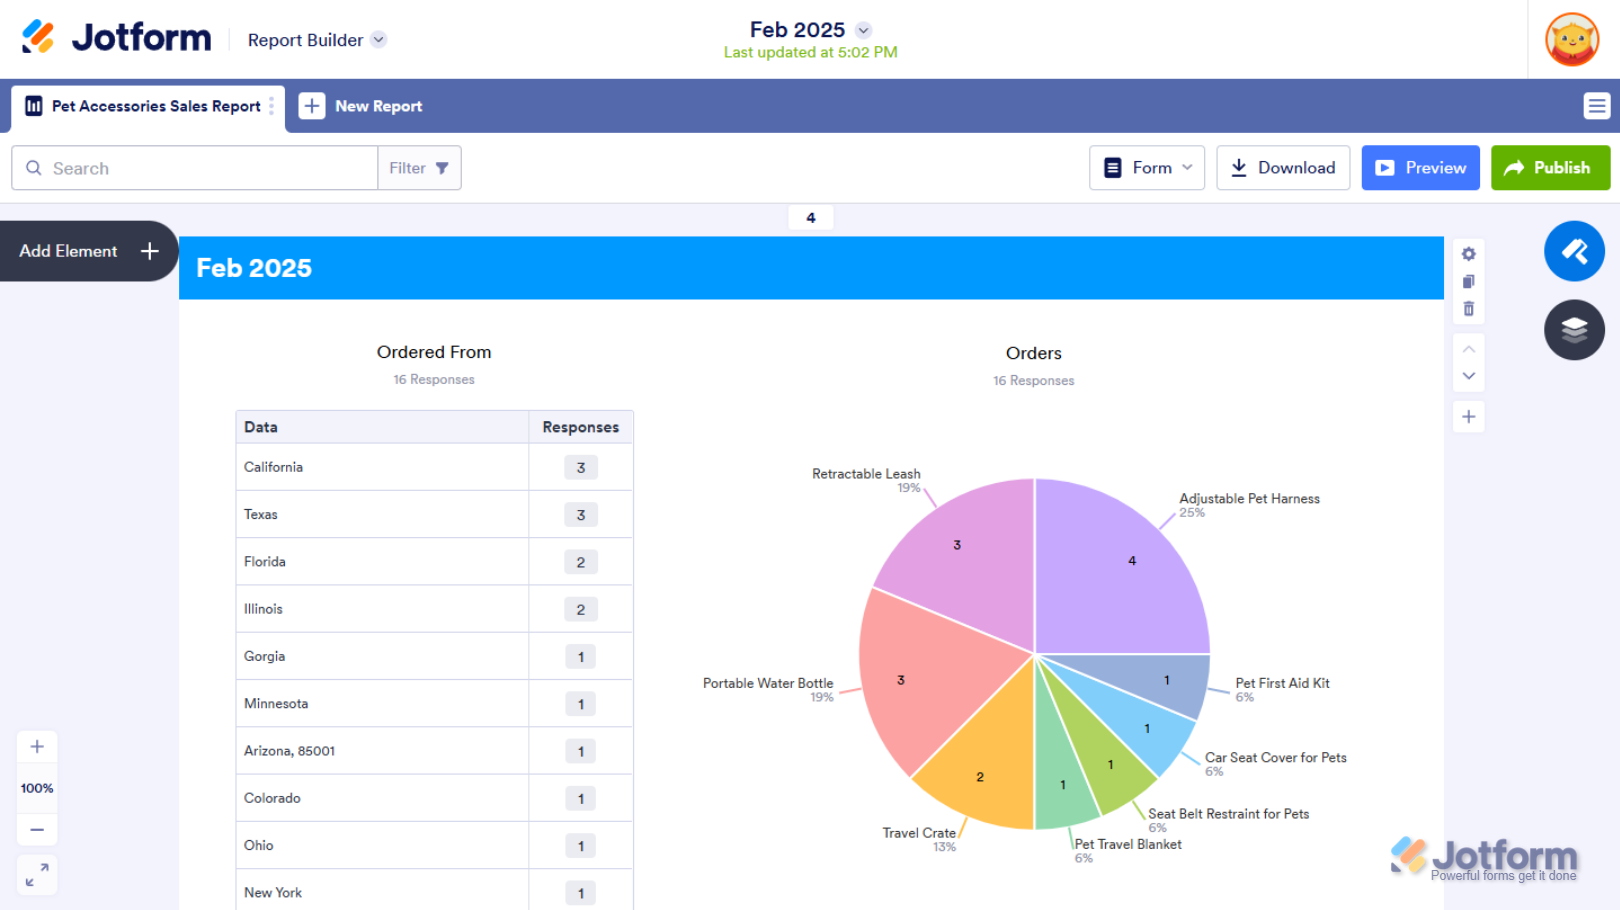
That’s it! You’ve now turned the data in your Excel or CSV file into a Visual Report.

Send Comment:
2 Comments:
323 days ago
I'm wondering if after we customize a report (colors, styles etc) if we can save the report as a template to be used again and again without having to go in and change it each time? Or, if that isn't possible, is there a way to change color palette for the entire report so we don't have to change page each header individually?
More than a year ago
Good place to be for academic purpose. I like to continue with jotform.com