How to present your survey results
- Choose the best data to share
- Tell a story
- Adhere to common design rules
- Create an additional report
You’ve launched your survey. The results are in. Now it’s time to make sense of them.
Creating a survey results presentation is one of the best ways to analyze your results and present them to stakeholders in a format that makes them clear and understandable.
It’s not as simple as copying and pasting everything into a PowerPoint presentation, though. Here’s how you can create an awesome survey results presentation.
Why you should turn survey results into a presentation
Not everyone is going to be willing to sift through all your survey responses and tease out the relevant findings. That’s why you need to succinctly summarize those findings and make them digestible for everyone. A survey results presentation is the perfect tool.
Pro Tip
For a more engaging presentation experience, take your visuals a step further with Jotform Presentation Agents. Turn your data insights into interactive, voice-guided presentations, without needing a live presenter.
How to create a survey results presentation: Best practices
Before you rush to turn your responses into a presentation, take the time to acquaint yourself with the following best practices.
Choose the best data to share
Not every insight you collect from your survey is going to be relevant to your target audience for a presentation, so be sure to
- Narrow down your dataset to include only information that pertains to your audience’s interests
- Think about what you want your audience to take away from your presentation. For example, do you want to show engagement? Changing consumer opinions? Market trends?
- Choose your data accordingly
Tell a story
If you really want to capture your audience’s attention, tell a story with your presentation. You can do this by
- Explaining what the findings mean and why your audience should care, rather than just showing the raw data
- Showing how the results connect with the business’s goals and mission
- Using specific examples can make your presentations much more powerful, writes corporate trainer Dana Brownlee
Adhere to common design rules
There are several design best practices you should follow, writes Shonna Waters, Ph.D., vice president of strategic alliances and partnerships at professional coaching platform BetterUp. These include
- Using a minimalistic background
- Placing only your major points on each slide
- Avoiding blocks of copy
- Using a limited number of slides
“Keep in mind that although color, images, and graphics liven things up, they can cause distraction when misused,” Waters advises.
Create an additional report
Not all of your survey findings will be suitable to include in your presentation, but they may still be essential for stakeholders to know about. According to Swetha Amaresan, senior marketing coordinator at Nickelodeon International, you can supplement your presentation by
- Handing this report to stakeholders to look through outside of your presentation
- Preparing a full printed report of your results in advance that includes more detail and covers potential questions from stakeholders.
Turn survey results into a presentation with Jotform Report Builder
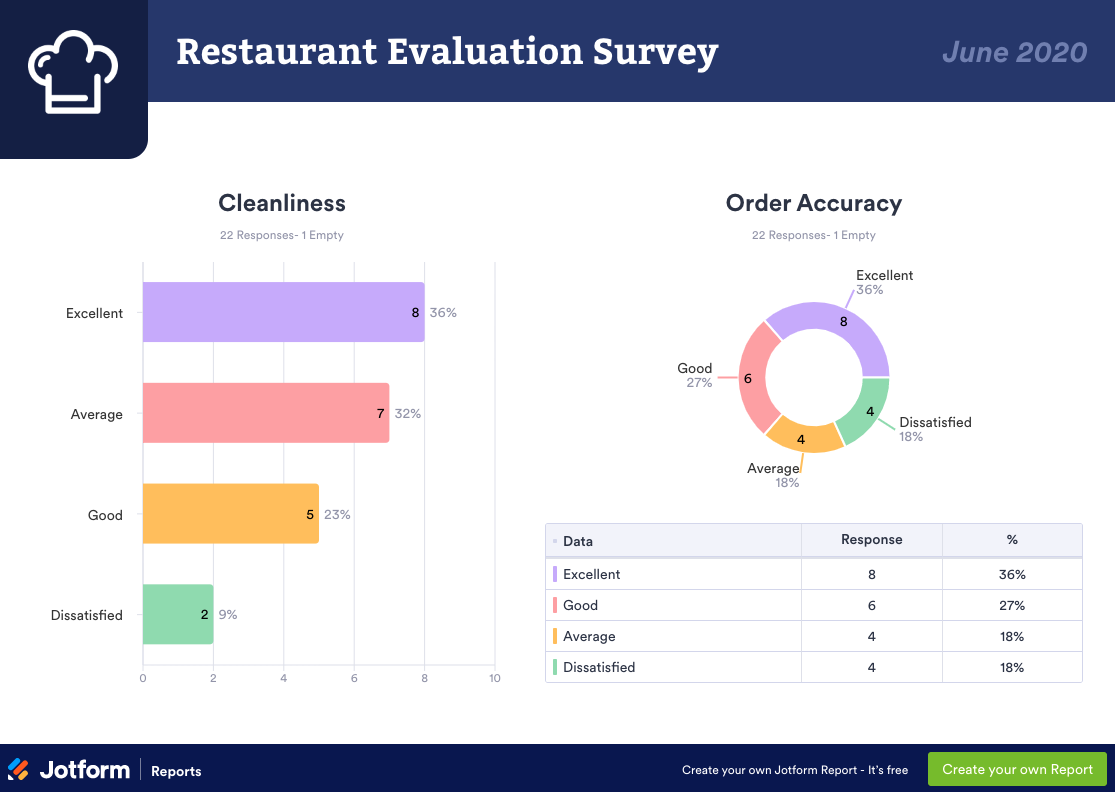
If you’re worried about keeping track of all the best practices above, let Jotform’s Report Builder do the hard work for you. Jotform Report Builder automatically turns your Jotform survey responses into beautiful, professional reports.
Create the perfect report with a range of charts and tables. You can drag and drop design elements to suit your tastes. Don’t worry about having to update your presentation once it’s designed — presentations are updated automatically with each new form submission.
Just so you know
You can automatically turn your survey responses into professional presentations with Jotform Report Builder.
How Jotform can make surveys easy
Whether you want to create a survey or turn your existing survey into a report, Jotform is the ideal tool. With over 800 free survey templates, it’s easy to get started.
You can tailor the survey to your needs, choosing the format that works best for you. That could be a classic survey where all questions are listed on a single page, or you may opt for Jotform Cards, where you ask one question per page.
If you want to dig deeper, you can use conditional logic to create an interactive survey that changes depending on each user’s response. Conditional logic improves the quality of answers from respondents while also improving the completion rate.
With Jotform, you never have to worry about privacy or security. All Jotform form data is protected with a 256-bit SSL connection and is compliant with the General Data Protection Regulation and the California Consumer Privacy Act. You can even add an optional feature that helps with HIPAA compliance if you’re creating a healthcare survey.






























Send Comment: